Systematic reviews can be defined as “explicitly formulated, reproducible and up-to-
date summaries of the effects of health care interventions". They use a very structured
method that is always explicitly stated at the beginning of the review. Systematic
reviews are usually prepared by a team of at least two reviewers who have a thorough
understanding of both the clinical area and review methodology. This serves to minimize
human error and bias.
Systematic reviews should not be confused with meta-analysis, which are in effect
a statistical analysis of the results from separate studies. While the latter are
often included in systematic reviews, this is not always possible.
Systematic reviews are:
Condensed : Allow the reader to access consolidated results of huge volumes
of information;
Objective : Reduce (though not eliminate) the risk of bias and error;
Balanced : Includes a broad range of studies which are identified via a thorough
and systematic search strategy;
Verifiable : Incorporate transparent processes that allow the reader to know
exactly how the conclusions were reached;
Replicable : Use a structured methodology;
Flexible : Can be updated on a regular basis;
Dynamic : In identifying areas that are under-researched or in identifying
new research questions;
Readable : Presented in a format that is easy to read and understand.
Systematic Review Process
The systematic reviews need proof for the development of a formal scientific process,
assessing the findings and their application to the practice needs, understanding
of the approach taken and the attempts to minimise the bias. The overall process
should, ideally, be directed by a peer reviewed protocol. Briefly, developing a
systematic review requires the following steps:
1. Define healthcare question
This requires clarity of the review’s objectives, intervention or phenomena of interest,
relevant patient groups and sub-populations (and sometime the settings where the
intervention are administered), the types of evidence of studies that will help
answer the question, as well as appropriate outcomes. These details are rigorously
used to select studies for inclusion in the review.
2. Searching the literature
The published and unpublished literature is carefully searched for an intervention
or activity (on the right patients, reporting the right outcomes and so on). For
an unbiased assessment, a designated number of databases are searched using a standardised
or customised search filter. Furthermore, the grey literature (material that is
not formally published, such as institutional or technical reports, working papers,
conference proceedings or other documents not normally subject to editorial control
or peer review) is searched using specialised search engines. Expert opinion on
where appropriate data may be located is sought and key authors are contacted for
clarification. Selected journals are hand-searched. Potential biases within this
search are publication bias, selection bias and language bias.
3. Studies assessment
Once all possible studies have been identified, they should be assessed in the following
ways:
Eligibility against inclusion criteria and full text papers are retrieved for those
that meet the inclusion criteria.
Following a full-text selection stage, the remaining studies are assessed for methodological
quality using a critical appraisal framework. Poor quality studies are excluded
but are usually discussed in the review report.
Of the remaining studies, reported findings are extracted onto a data extraction
form. Some studies will be excluded even at this late stage. A list of included
studies is then created.
Assessment should ideally be conducted by two independent reviewers.
4. Combining the results
The findings from the individual studies must then be aggregated to produce a ‘bottom
line’ on the clinical effectiveness, feasibility, appropriateness and meaningfulness
of the intervention or activity. This aggregation of findings is called evidence
synthesis. The type of evidence synthesis is chosen to fit the types(s) of data
within the review. For example, if a systematic review inspects qualitative data,
then a meta- synthesis is conducted. Alternatively, a technique known as meta-analysis
is used if homogenous quantitative evidence is assessed for clinical effectiveness.
Narrative summaries are used if quantitative data are not homogenous.
5. Placing the findings in context
The findings from this aggregation of an unbiased selection of studies then needs
to be discussed to put them into context. This will address issues such as the quality
and heterogeneity of the included studies, the likely impact of bias, as well as
the chance and the applicability of the findings. Thus, judgement and balance are
not obviated by the rigour of systematic reviews – they are just reduced in impact
and made more explicit.
Critical Appraisal
The process starts with careful examination of all aspects of the studies selected
for inclusion in the systematic review. This breaks down the components of the study
to evaluate characteristics of participants, outcome measures used, completeness
of study follow up and appropriateness of statistical measures. Critical appraisal
requires dedicated time and expertise.
Study Designs
For Diagnosis
Study Designs
This short article gives a brief guide to the different study types and a comparison
of the advantages and disadvantages of the different types of study.
All these study designs have similar components:
A defined population (P) from which groups of subjects are studied and Outcomes
(O) are measured for experimental and analytic observational studies. Interventions
(I) or exposures (E) that are applied to different groups of subjects.
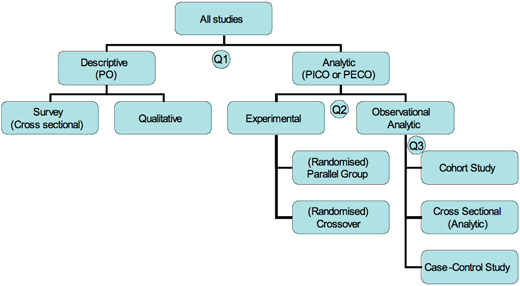
Figure: Tree of different types of studies.
Overview of the design tree (Figure) shows the tree of possible designs, branching
into subgroups of study designs by whether the studies are descriptive or analytic
and by whether the analytic studies are experimental or observational. The list
is not completely exhaustive but covers most basics designs.
An analytic study attempts to quantify the relationship between two factors, that
is, the effect of an intervention (I) or exposure (E) on an outcome (O). To quantify
the effect we will need to know the rate of outcomes in a comparison (C) group as
well as the intervention or exposed group.
Analytical observational studies include case–control studies, cohort studies and
some population (cross-sectional) studies. These studies all include matched groups
of subjects and assessment of associations between exposures and outcomes.
Observational studies investigate and record exposures (such as interventions or
risk factors) and observe outcomes (such as disease) as they occur. Such studies
may be purely descriptive or more analytical.
We should finally note that studies can incorporate several design elements. For
example,the control arm of a randomised trial may also be used as a cohort study
and the baseline measures of a cohort study may be used as a cross-sectional study.
Randomised Control Trials
Cohort Studies
Case Control Studies
Cross sectional
Randomised Control Trials
A randomised controlled trial is simply an experiment performed on human subjects
to assess the efficacy of a new treatment for condition. Randomised controlled trials
are the most rigorous way of determining whether a cause-effect relation exists
between treatment and outcome and assess the cost effectiveness of a treatment.
They have several important features:
Random allocation to intervention groups.
Patients and trialists should
remain unaware of which treatment was given until the study is completed—although
such double blind studies are not always feasible or appropriate.
All intervention groups are treated identically except for the experimental treatment.
Patients are normally analysed within the group to which they were allocated, irrespective
of whether they experienced the intended intervention (intention to treat analysis).
The analysis is focused on estimating the size of the difference in predefined outcomes
between intervention groups.
Advantages
Unbiased distribution of confounders.
Blinding more likely.
Randomisation facilitates statistical analysis.
Disadvantages
Expensive and time comsuming.
Volunteer bias.
Ethically problematic at times.
Crossover Design
A controlled trial where each study participant has both therapies, e.g it is randomised
to treatment A first, at the crossover point they then start treatment B. Only relevant
if the outcome is reversible with time, e.g symptoms.
Advantages
All subjects serve as own controls and error variance is reduced thus reducing sample
size needed.
All subjects receive treatment (at least some of the time).
Statistical tests assuming randomisation can be used.
Blinding can be maintained.
Disadvantages
All subjects receive placebo or alternative treatment at some point.
Washout period lengthy or unknown.
Cannot be used for treatments with permanent effects.
Cohort Studies
Cohort Study is a study in which subjects who presently have a certain condition
and/or receive a particular treatment are followed over time and compared with another
group who are not affected by the condition under investigation.
Cohort studies are also called follow up or incidence or prospective studies. They
provide the best information about the causation of disease and the most direct
measurement of the risk of developing a disease. It is best to study the effect
of predictive risk factors on an outcome.
Advantages
Ethically safe.
Subjects can be matched.
Can establish timing and directionality of events.
Eligibility criteria and outcome assessments can be standardised.
Administratively easier and cheaper than RCT.
Disadvantages
Controls may be difficult to identify.
Exposure may be linked to a hidden confounder.
Blinding is difficult.
Randomisation not present.
For rare disease, large sample sizes or long follow-up necessary.
Potential bias: recall, selection.
Case Control Studies
Case control studies provide a relatively simple way to investigate causes of diseases
especially rare diseases. They include people with a disease of interest and a suitable
control group of people unaffected by the disease or outcome variable. The study
compares the occurrence of the possible causes in cases and controls.
Case control studies are longitudinal studies and are also called retrospective
studies since the investigator is looking backward from disease to a possible cause.
Patients with a certain outcome or disease and an appropriate group of controls
without the outcome or disease are selected (usually with careful consideration
of appropriate choice of controls, matching, etc) and then information is obtained
on whether the subjects have been exposed to the factor under investigation.
Advantages
Quick and cheap.
Only feasible method for very rare disorders or those with long lag between exposure
and outcome.
Fewer subjects needed than cross-sectional studies.
Disadvantages:
Reliance on recall or records to determine exposure status.
Confounders.
Selection of control groups is difficult.
Cross Sectional Studied
A study that examines the relationship between diseases (or other health-related
characteristics) and other variables of interest as they exist in a defined population
at one particular time (i.e exposure and outcomes are both measured at the same
time). Best for quantifying the prevalence of a disease or risk factor and the accuracy
of a diagnostic test.
Advantages
Cheap and simple.
Ethically safe.
Disadvantages
Establishes association at most, not causality.
Recall bias susceptibility.
Confounders may be unequally distributed.
Neyman bias.
For Diagnosis
Pre-test Probability
Definition
Pre- test Probability is defined as the probability of the target disorder before
a diagnostic test result is known. It represents the probability that a specific
patient, say a middle- aged man, with a specific past history, say hypertension
and cigarette smoking, who presents to a specific clinical setting, like accident
and emergency, with a specific symptom complex, say retrosternal chest pressure,
dyspnoea and diaphoresis, has a specific diagnosis, such as acute myocardial infarction.
Application
The pretest probability is especially useful for four things:
Interpreting the results of a diagnostic test.
Selecting one or more diagnostic
tests.
Choosing whether to start therapy.
without further testing (treatment threshold).
while awaiting further testing.
Deciding whether it's worth testing at all (test threshold).
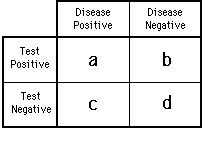
Positive Predictive Value: The proportion of people with a positive test who have
the target disorder.
Negative Predictive Value: The proportion of people with a negative test who do
not have the target disorder.
Often the best place to look for SpPins and SnNouts is at the highest (for SpPins)
and lowest (for SnNouts) levels of multilevel likelihood ratios.
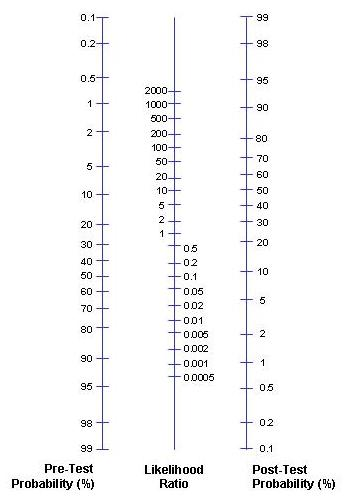
The Likelihood Ratio (LR) is the likelihood that a given test result would be expected
in a patient with the target disorder compared to the likelihood that the same result
would be expected in a patient without the target disorder.
Application
The LR is used to assess how good a diagnostic test is and to help in selecting
an appropriate diagnostic test(s) or sequence of tests. They have advantages over
sensitivity and specificity because they are less likely to change with the prevalence
of the disorder, they can be calculated for several levels of the symptom/sign or
test, they can be used to combine the results of multiple diagnostic test and be
used to calculate post-test probability for a target disorder.
Cookies help us to deliver our services. By using our services you agree to our use of cookies.